
Web Services
Development of Survey123 Application for Collection of Spatially Located Regional Dialect Data
Problem
Analyses of regional dialects, pronunciation, and vocabulary are inherently spatial in nature. Surveys have traditionally been an important tool for researchers seeking to generate information about linguistic patterns both within and between regional areas, with respondents’ geographic locations and residence history as a key survey component. With a strong New Jersey family background, a childhood spent in Virginia, and adulthood spent in North Carolina, I have noticed several variations of what I have come to call “gosh darn it” phrases. These include similar three-syllable variations such as “dagnabbit,” “dadgummit,” and “doggonit.” I was interested in performing a regional spatial autocorrelation of the most popular uses of these phrases across the United States; however, this data has not yet been collected. With the goal of eventually analyzing such regional patterns, I designed an online survey via ESRI’s Survey123 with a spatial data collection component to begin accumulating data points.
Analysis Procedures
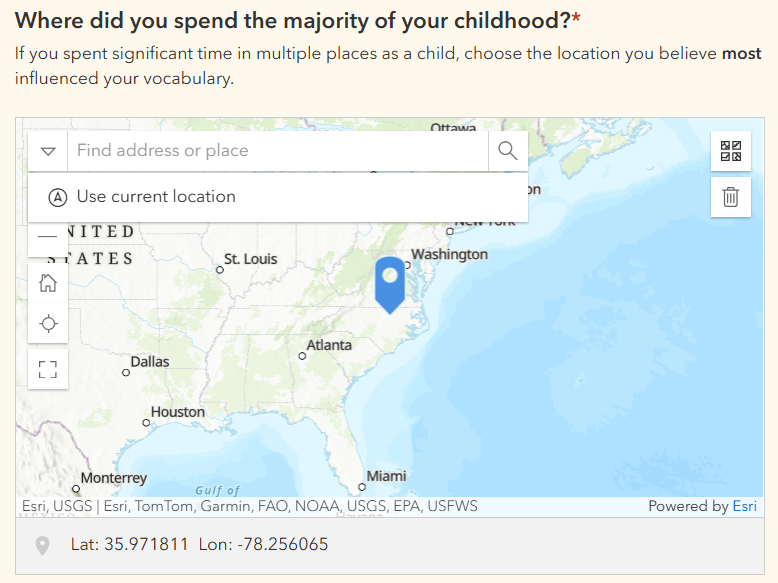
To address the necessary spatial component of the survey, two questions were added prompting the user to add a point indicating the location where most of their childhood as well as where most of their adulthood was spent. Anticipating that generational differences may play an important role in vocabulary, the survey begins with a question asking respondents for their year of birth; the response to this question determines whether both the childhood and adult location questions are presented. Keeping in mind that some respondents may not use a phrase like this, subsequent questions are only presented if the respondent claims to use a phrase like this based on the provided definition, including a checklist question of all phrases used and a single choice question to indicate the user’s most used phrase. To provide additional spatial context if available, if the respondent is certain of where or from whom they picked up a variation, for example, from visits to a grandparent in Ohio, they can provide this information in subsequent optional questions.
Results
The resulting survey is distributable publicly, with an intuitive format presenting questions only if relevant based upon responses. Data is compiled in visual charts for quick interpretation. Each set of responses is attached to the spatial points provided, and data can be exported in both tabular format, to shapefile or file geodatabase, or viewed directly within ArcGIS Online. Take a look or respond to the survey here.

Reflection
This project allowed me to practice designing a thorough survey with key spatial components using a tool compatible with the GIS software of many organizations. Although this was an exploratory example forming the beginnings for a personal project, the practical applications of Survey123 and its sister software Survey123 Connect in linguistics, resource management, marketing, and numerous other fields are endless. In the initial phases of my capstone project developing a research archive of projects conducted within the several forests managed by NC State’s College of Natural Resources, my partners and I identified Survey123 as an ideal tool for data collection. By distributing a survey to former faculty, we plan to identify the topics, contacts, and locations of past research studies. The spatial component of the survey will allow this data to be integrated with the College’s existing forest management database. Designing a survey from scratch pushed me to think critically about data structure, field types, and user experience, and strengthened my understanding of how survey tools can streamline spatial data collection.
Creating a Customized Basemap of Ocean County, New Jersey for Use in Web Applications
Problem
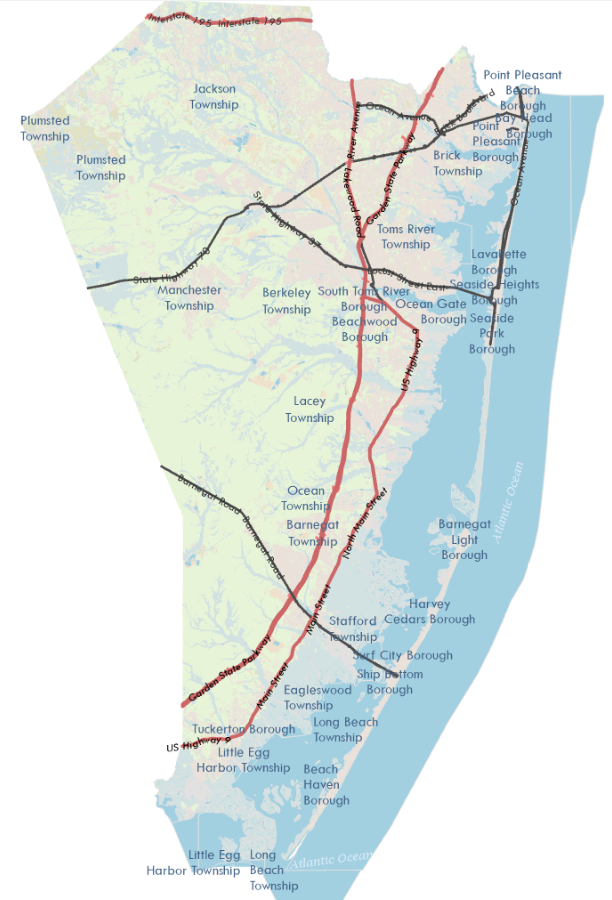
The selection of an appealing and informative basemap can enhance or detract from the best GIS products. The goal of this project was to design a customized basemap for a small regional area, providing the necessary information to contextualize features highlighted in the area. The extent selected for my basemap was Ocean County, New Jersey, a coastal county containing several barrier islands as well as major highways. The secondary goal of this project was to maintain clarity and relevance by differently symbolizing features across multiple zoom levels.
Analysis Procedures
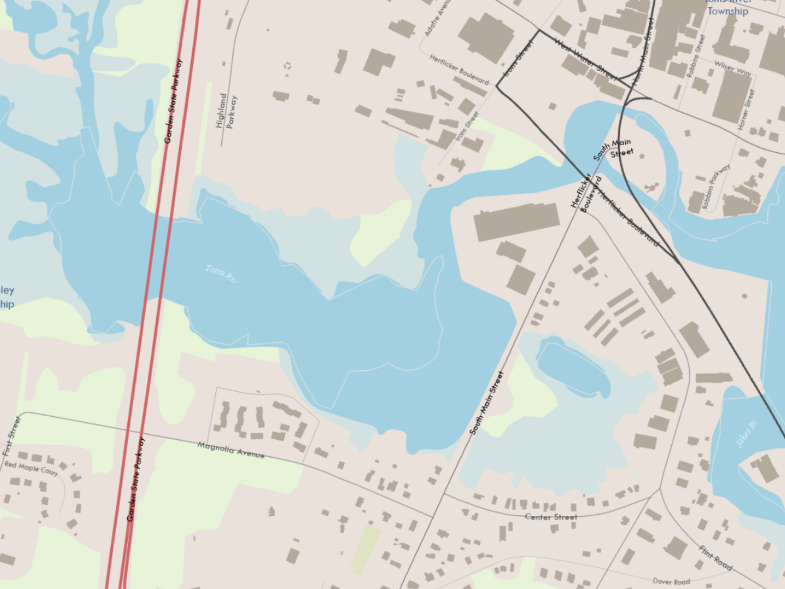
To begin the project, I sourced several relevant layers containing features that could contextualize the county without the help of existing basemaps. These layers, including roads, land use and land cover, water bodies, structures, and municipal boundaries, were imported into ArcGIS Pro and appropriately symbolized and labeled by attribute; for example interstate highways were symbolized differently than neighborhood roads. Scale dependencies were added for several layers such that features and labels were only visible at certain zoom levels.
After finalizing the basemap, I published it to ArcGIS Server, ensuring accessibility as a REST service. It was then added to an ArcGIS Online Web Map for use in future web applications.
Results
The below images show both a large-scale and small-scale example of the basemap’s content. View the web app here.
Reflection
This project reinforced my understanding of basemap design principles, symbology, and web map publishing. One unexpected challenge was that the minimum and maximum extent settings set in ArcGIS Pro did not appear as expected in ArcGIS Online. However, this did not impact the functionality of scale dependencies or the web app display. Troubleshooting this issue highlighted the complexities of publishing tiled services. When designing maps, basemap inclusions often feel “automatic,” but considerable thought must be dedicated to producing basemaps that are functional, legible, and useful – even for small areas. Overall, this experience deepened my skills in cartographic design, ArcGIS Pro workflows, and web GIS deployment.
