Predicting Landcover in Central Virginia Using Supervised Random Forest Modeling
Problem
The goal of this project was to classify land cover in a region of Central Virginia using procured satellite imagery and a supervised random forest model. The region includes a mix of urban, water, forest, and agricultural or grassland areas. Using only the satellite image and classification model, I aimed to assign each pixel to one of four discrete land cover categories and evaluate how effectively these surface types could be distinguished based on spectral information and NDVI (Normalized Difference Vegetation Index).
Analysis Procedures
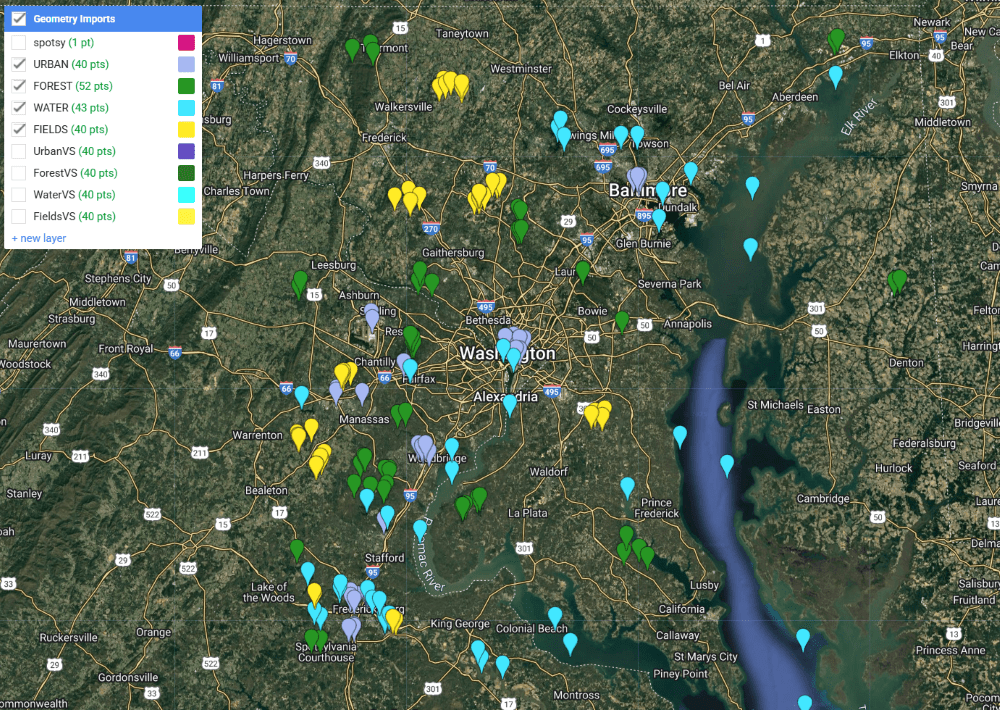
The entirely of the project was conducted in Google Earth Engine using JavaScript. First, a Landsat 8 image was obtained by filtering this dataset for summer months and selecting the image the least obscured by cloud cover. An NDVI was calculated and added as a band to the image. To begin the process of classifying land use and land cover for the full image extent, I manually added 30 points to the map, identifying areas of urban, forest, field, and water cover. These training sample points were then used in a random forest classifier, whose results were visualized in a categorical map.
Finally, to test the accuracy of the analysis, a new set of points was added for each category to serve as validation samples. These were compared with the classification image in an error matrix.
Results
The images below show the training sample points (left) used to generate the classified image over the full extent of the initial Landsat image (right). Overall, a visual comparison of the images indicates that the model was successful in distinguishing urban, forest, field, and water areas. The highest concentrations of urban areas (shown in gray) are located in Washington, DC and Baltimore, and waterways like the Chesapeake Bay and Potomac River are clearly distinguished.
The overall accuracy was 89%, with water and forests most accurately classified, and fields and urban areas least accurately classified.

Reflection
Having limited experience both in programming and with the Google Earth Engine platform, this project enhanced my ability and confidence to conduct analyses drawing on both satellite imagery and statistical models. I didn’t anticipate the degree to which urban areas would be classified as fields. Since my sample area contains two major cities, I focused on adding urban sample points to different types of buildings in those cities. To improve this, I would focus on more ambiguous areas, since my data included a lot of suburban and rural areas. Although I had run a few analyses in Google Earth Engine prior to completing this project, this exercise was the one that inspired me to consider the numerous practical applications and impactful work that could be facilitated by understanding how to find and sort through satellite imagery and manipulate these images to generate new information. Moving forward, I hope to leverage satellite imagery and remote sensing analyses to identify environmental patterns — such as ice cover, flooding, or waste — in areas where on-the-ground data may be limited. Tools like these are especially valuable for assessing conditions like tree canopy or surface change that can serve as proxies for public health and environmental quality.
Mapping Raleigh Historic Landmarks: Customized Analyses via User Input
Problem
The Raleigh Historic Development Commission has designated over 150 Raleigh Historic Landmarks, publishing a dataset with attributes such as construction and designation years. I was interested in exploring this dataset to better understand trends in the length of time between a site’s construction and its designation as a historical site. Patterns and trends including the historical period and type of site when compared to the length of time taken to codify its historic significance, may reveal interesting insights about the Raleigh area’s history and factors that lead to designations. To explore this, I developed a custom tool that allows users to filter and generate a feature class of all landmarks based on user-defined parameters.
Analysis Procedures
The project was completed using ArcGIS Pro and Python script. An initial challenge was that the dataset construction and designation dates did not exist in a common format, so in addition to extracting key attributes, the data cleaning process also involved extracting a 4 digit year for each construction and designation date (using the first date if construction took place over several years). Sites without these attributes were removed. Since site locations were listed by street address, I appended “Raleigh, NC” to each address, and generated X,Y coordinates for each address using ArcGIS API for Python’s geocode function.
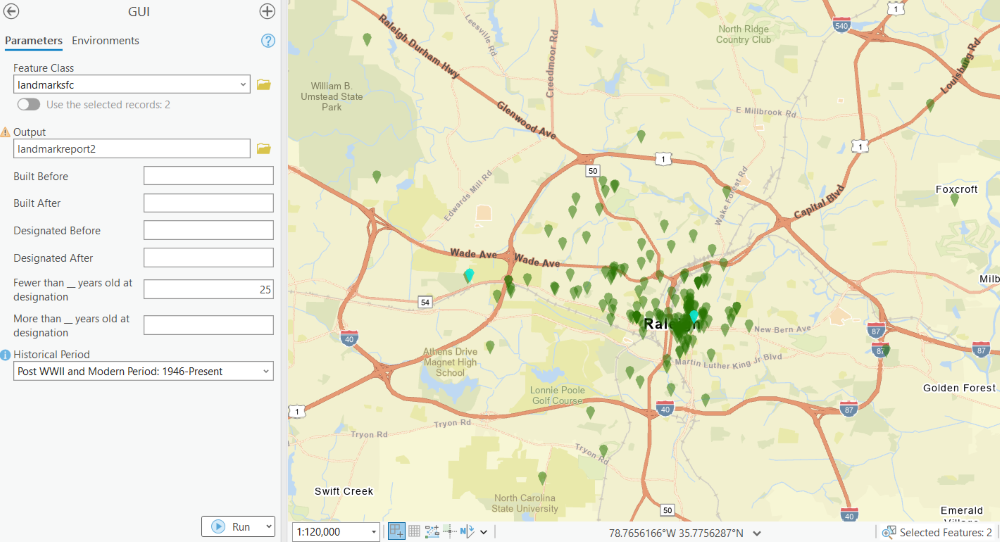
After extracting attributes for each feature, a feature class using this data was created in the designated file geodatabase and added to an ArcGIS Pro map for review. I then created a graphical user interface (GUI) in ArcGIS Pro with custom parameters executed via Python script. The script takes an input feature class and generates a customized output feature class by constructing SQL queries based on the filters provided. Users can specify criteria such as construction or designation date ranges, historical periods of interest, and the age of a building at the time of designation; in the case of the landmarks feature class this tool was built for, features meeting the designated attribute criteria are selected and displayed on the map.
Results
The final GUI with example queries is shown to the right. Because some of my questions about the dataset took on varying formats, I wanted the tool to be as flexible as possible, with all inputs set as optional. The immediate display of selected features allows for both quick visual evaluation or more detailed further analysis.
Reflection
As a Python beginner, this project was crucial in bringing together both new scripting skills and my GIS experience. I encountered several challenges – such as data formatting inconsistencies and building a functioning GUI – but found helpful resources that allowed me to execute my vision for the project. I enjoyed the opportunity to work with historical data and to design a flexible tool that could support open-ended exploration of spatial patterns.
This project gave me a strong foundation for automating spatial analysis tasks, and it deepened my interest in building interactive tools that make GIS more accessible to all users.